|
GML
v1.0.0-2994
Gorman Maintenance Logs
|


|
|
GML
v1.0.0-2994
Gorman Maintenance Logs
|
|
This is the central window to GML.
In normal usage, this is the first window that will appear on the screen after GML is started.
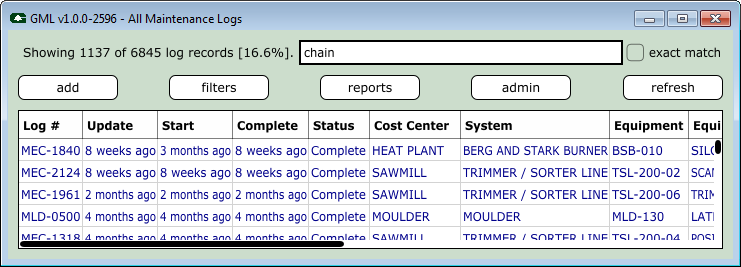
The central part of this window provides a summary of all maintenance logs for a given department.
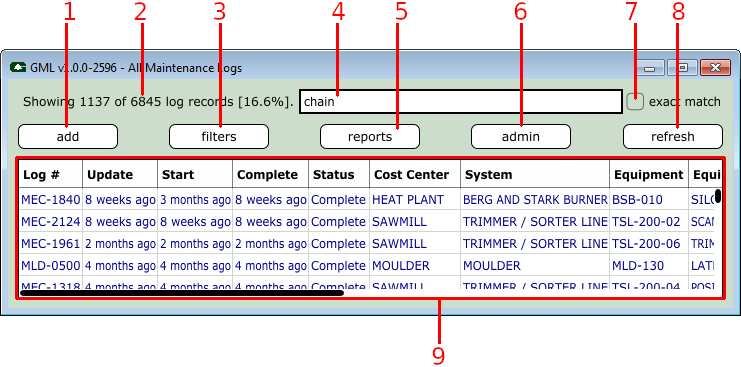
The same windows as above, but with key features identified:
| Feature | Description |
|---|---|
| #1 | The add button will bring up the Editor Window. This is how new maintenance logs are added to the database. |
| #2 | Status text gives some information on the number of log entries displayed versus the number of entries in the database. |
| #3 | For convenience, several built-in filters can be selected from this button. |
| #4 | Text entered in this field is used to filter the log entries shown in the table. See Search Filter. |
| #5 | Generate reports based on the displayed or selected maintenance logs. See Report Window. |
| #6 | Access to the Admininistration Tools. This is only shown if the current user's defined role has access to ¾ or more of the configured departments. |
| #7 | Toggle to determine if the search filter must be an exact match. More on this advanced option below. See Exact Match. |
| #8 | Force GML to immediately reload all the log entries from the database. |
| #9 | Set of all maintenance logs for the selected department, and which match the filter text. Double-click on a row to open the Editor Window. |
The search filter field is used to specify text filters which GML then uses to decide which maintenance log must be displayed. Multiple search filters may be used, each separated by 1 or more spaces.
If the search field is left blank, then all log entries are displayed. If one or more search filter is specified, then the log entries will then be filtered and sorted by the number of matches found within the log record.
"chain", "Chain", or "CHAIN" will yield similar results. "special filters" uses partial word matching. Searching for "ain" will match "chain", "chains", "plain", "train", "again", "maintenance", etc. "chain broken" or "broken chain" will match the same maintenance records since search terms are individually handled.Examples of search filters:
| Filter | Notes |
|---|---|
broken chain jump | Three search terms, can appear in any order, or in any field. If "exact match" is not set, then will also return log records with only 1 or 2 of these terms. |
replace belt | |
log=mec time>12h | Log ID must contain "mec", and the time must be greater than or equal to 12 hours. |
log=m time>12h | Log ID must contain "m", such as "mec" or "mld". |
system=stack lug week | Remember that all search terms also perform partial word matches:
|
downtime<>rock | Downtime reason must not include the word (or partial word) "rock". |
category<>other log=p1 | Category must not include the word "other", and the log ID must contain "p1". |
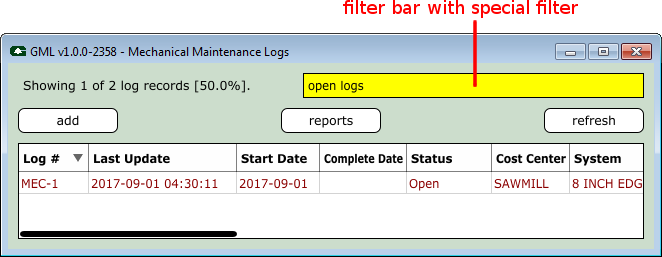
There are several special keywords that may be used to trigger built-in filters. When used, the filter bar background will be yellow to indicate that log filtering behaviour is different than normal. The filter text is case-insensitive, but otherwise the text must be an exact match and cannot be combined with other filters.
The existing special filters are:
| Filter | Description |
|---|---|
open logs | Only open logs will be displayed. |
24 hours | Only logs modified in the last 24 hours will be displayed. |
7 days | Only logs modified in the last 7 days will be displayed. |
A select number of columns can be targeted by name when doing a search. The columns that can be explicitly named are:
time column can use the special operator < and > as well as =. = and <> (the second one means "not-equal-to").An example search might be "updated=2017-10-10". This would match all maintenance log entries that were last updated on the specified date. Partial matches also work, so "updated=2017-10" would match all maintenance logs updated on any day in October 2017.
| Column Name | Usage | Example |
|---|---|---|
| Log # | log=... log<>... | log=mec log=p1 log<>mld |
| Last Update | updated=... updated<>... | updated=2017-10 updated=2017-12-25 updated<>2019-02 |
| Start Date | started=... started<>... | started=2017-10 started=2017-12-25 started<>2019-02 |
| Complete Date | completed=... completed<>... | completed=2017-10 completed=2017-12-25 completed<>2019-02 |
| Status | status=... status<>... | status=open status=complete status<>complete |
| System | system=... system=<>... | system=edger system=#2 system<>planer |
| Time (lesser than or equal to) | time<... | time<45m time<0h45m time<0.75h |
| Time (greater than or equal to) | time>... | time>45m time>0h45m time>0.75h |
| Time (equal to, exact match) | time=... | time=45m time=0h45m time=0.75h |
| Downtime Reason | downtime=... downtime<>... | downtime=rocks downtime<>rocks |
| Category | category=... category<>... | category=other category<>n/a |
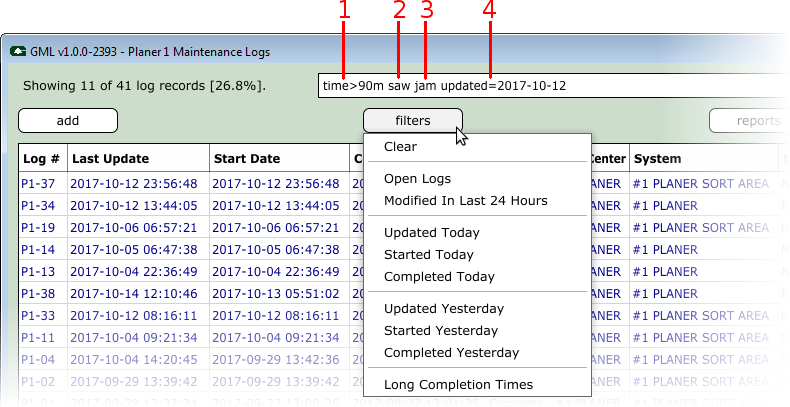
The example image above shows a maintenance log filter composed of 4 separate parts:
| Filter | Filter Text | Description |
|---|---|---|
| #1 | time>90m | Includes logs where the "time" column is greater than or equal to 90 minutes. |
| #2 | saw | Includes logs which contain the word "saw". |
| #3 | jam | Includes logs which contain the word "jam". |
| #4 | updated=2017-10-12 | Includes logs which were last updated on October 12, 2017. |
Normally, the summary window displays all log entries that match at least 1 of the filter terms. The log entries are then sorted according to the total number of keyword matches.
But when "exact match" is enabled, then all filter search terms must match for a log entry to be shown.
For example, see this search:
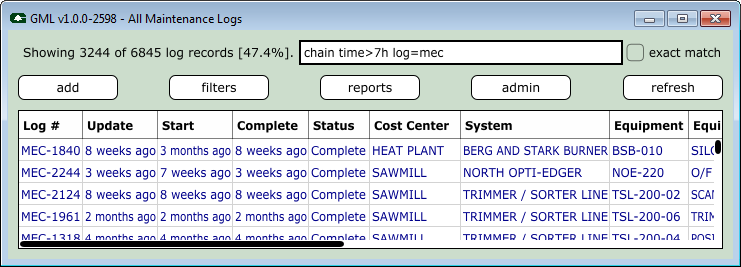
There are 3 search filters in this example:
"chain" must appear somewhere in the maintenance log. "mec".Using this example, nearly 50% of the log entries are considered a possible match. By default, listed at the top of the summary window will be those entries that match all 3 filter terms. At the bottom of the window will be the log entries that only match 1 of the 3 filter terms.
The following shows the same example filters, but with "exact match" toggled:
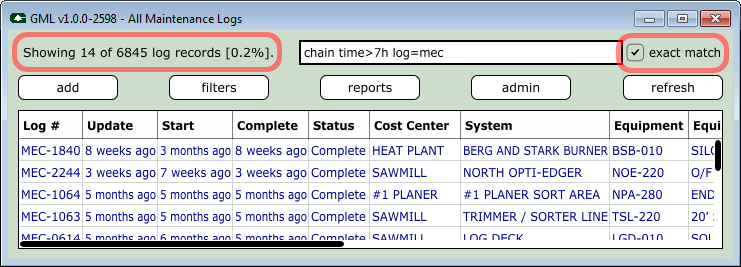
The number of matching records has been reduced from 3244 records to 14 which exactly match all 3 search term filters.
The columns displayed in the summary window are configurable:
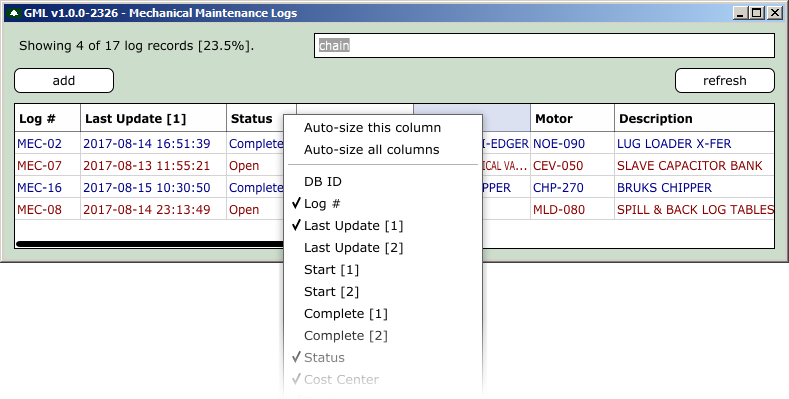
Right-mouse-click on any of the column headers to change the columns you'd like to see. Note that the column currently used to sort the table cannot be removed.
To change the column order, click-and-drag the column header to a new location.
Any changes you made to column visibility, column order, and column width will be remembered and restored when GML is restarted.
The following keys activate additional functionality:
| Key | Description |
|---|---|
F1 | Display version information. |
F2 + SHIFT | Open the folder where the configuration file is stored on disk. See Configuration. |
F3 | Display information on current and recent database user sessions. |
F4 + SHIFT | Open the GML log file. This is mostly intended for debug purposes. |
F12 + SHIFT + CONTROL | Open the Choose A Role window. |
 1.8.13